News
H2 value chain analysis comparing different transport vectors—Part 1
Special Focus: Hydrogen Infrastructure Development
H2 value chain analysis comparing different transport vectors—Part 1
Meeting the anticipated 10-fold increase in hydrogen requirements by 2050 has led to many studies evaluating the most techno-economic means to achieve this target. While fully green, large-scale value chains are still some way off, there is adequate hydrocarbon infrastructure in place where blue H2 could be produced.
This article assesses the options to convert a portion of the LNG supply chain already in place between Qatar and the UK into blue H2 and the different transport vectors to convey the H2. Transporting the H2 as liquid or in the form of ammonia (NH3) or other liquid organic H2 carriers (LOHC), such as methylcyclohexane (MCH), are common comparisons; however, retaining liquified natural gas (LNG) as the energy carrier is also considered. It is shown with available technology that LNG as the transport vector is economic compared to ammonia and LOHC, with liquid H2 (LH2) still somewhat more expensive but anticipated to decrease in cost.
Introduction to project study
As a result of global demand for natural gas and the general fact that the resource-rich areas of the world are at significant distances from their markets, well-established production and transportation methods have been developed. Full value chains, from gas wells to regasification terminals, have been put in place with economy of scale, equipment efficiency and optimization of every aspect being developed over the years.
Replacing these value chains with low-carbon and green forms of energy will require significant development of new and large-scale technologies not yet developed or proven. The largest electrolyzer project in development is 24 MW, with an expected carbon dioxide (CO2) emissions reduction of 0.04 MMtpy,1 approximately 3% of the scale of this study. The reuse of existing infrastructure should be considered as an interim measure while new technologies are developed if the lower CO2 emissions targets of 2030 and 2050 are to be achieved.
This article examines a well-established LNG value chain and the options to change a portion of it, limited by downstream infrastructure specifications, to blue H2. A number of studies and papers compare different transport vectors for delivering H2 to market, as there is significant cost involved in storage and transportation. However, these studies generally compare only the transportation of LH2 against either liquid NH3 or an LOHC, such as methanol or MCH.
The results of the studies vary depending on the export location, the import location and the distance between the two. Therefore, it can be concluded that one solution probably will not fit all situations in the future, and concept feasibility studies will be required for defined configurations. This is not dissimilar to LNG value chains, where the specific project characteristics determine the final detailed configurations.
One aspect to be considered in the production of blue H2 is the disposal of the CO2 captured in the process. It is generally assumed to be reinjected and stored permanently at the export location; however, two additional options exist:
- The CO2 can be reinjected into permanent storage at the import location
- The CO2 can be transported back to the export location for reinjection.
In this article, the second option is considered so that the four transportation vectors can be compared on a reasonably equal basis.
The Qatargas 2 (QG2) project is a fully integrated value chain linking all of the components from wells to market in a single project. Offshore wells in Qatar deliver gas to Ras Laffan, where two LNG mega-trains (Trains 4 and 5) are installed. The LNG is transported in dedicated Q-Max LNG carriers to the South Hook LNG terminal in Wales, UK.
There is consensus that up to 20 mol% H2 can be mixed with natural gas into the UK gas grid without many complications with respect to pipeline materials and end users receiving the gas.2 Siting a blue H2 plant consisting of steam methane reformers (SMRs) with carbon capture at this location is the reference for this study. The CO2 is liquefied and returned to Qatar by ship for reinjection. All three comparison options have the blue H2 plant sited at Qatar, where the captured CO2 is also compressed and reinjected.
Concept basis
This study considers four transportation vectors to convert natural gas from Ras Laffan Industrial City in northeast Qatar into an H2 product at South Hook LNG terminal in Milford Haven, West Wales, UK.
The product is transported 6,140 nautical mi (approximately 11,371 km) by ship from Qatar to South Hook LNG terminal in the UK.3 As shown in Fig. 1, the sea route is an established route via the Suez Canal,4 through which a large Q-Max LNG tanker of 266,000 m3 can pass.5 In all scenarios considered in this study, the same quantity of H2 delivery to the injection point on the UK gas grid is targeted.
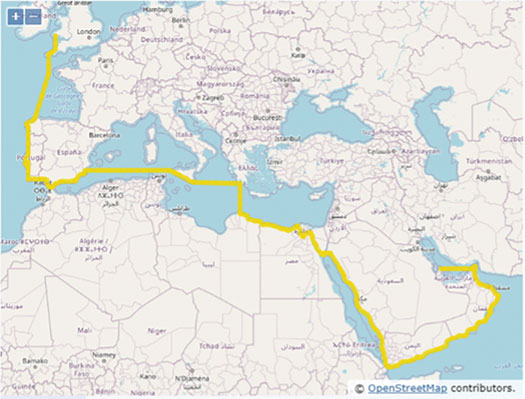
Fig. 1. Transport route for LNG produced at Ras Laffan, Qatar to regasification at Milford Haven, Wales, UK.
The LNG regasification terminal in South Hook has a design capacity of 15.6 MMtpy.6 An H2 blend with natural gas is considered to be acceptable with an upper limit of 20 mol% concentration H2 in natural gas.2 UK National Grid records7 show an approximately 40% average annual utilization of the South Hook terminal sending natural gas to the grid. Winter peak demand is countered by low energy demand during summer.
In this study, average natural gas usage of 6.24 MMtpy is considered as the baseload, and of this volume 0.541 MMtpy is converted to H2, corresponding to 0.171 MMtpy of H2 product at the delivery point. Mixing the H2 with the resulting natural gas produces 5.871 MMtpy of a 20 mol% H2 mixture into the export pipeline; the resulting calorific valve is slightly lower at approximately 98.5%. The estimated CO2 emissions reduction from the gas is 1.183 MMtpy, or approximately 7% compared to that emitted from the 100% natural gas reference flow.
For all scenarios, the CO2 produced during the natural gas conversion to H2 is captured for permanent storage in Qatar. It should be noted that CO2 is still emitted from various parts of the overall chain, such as power production and shipping.
To ensure a fair comparison between the processing routes, study boundaries were set. For all options, the upstream process boundary was fixed at the point where natural gas feed enters the system. The costs associated with natural gas production, front-end purification to remove impurities such as sulfur, and delivery to Ras Laffan are not included in this study. The downstream process boundary is set at H2 gas production at 20 bar before compression for distribution in pipelines.
Four scenarios for H2 transportation to determine the most economically efficient technical solution for transport are compared. All scenarios consider the product in liquid form at atmospheric pressure, based on ship type availability:
- LNG
- LH2
- NH3
- MCH.
Study definitions
Green H2 is generally defined as H2 produced from renewable power such as wind, solar or hydroelectricity via electrolysis. No hydrocarbons are used, and no CO2 is produced in the process.
Gray H2 is generally defined as H2 derived from hydrocarbons where CO2 is produced and emitted to the atmosphere in the process.
Blue H2 is generally defined as H2 derived from hydrocarbons where the CO2 produced in the process is captured and permanently stored. Blue H2 has a range depending on the percentage of CO2 captured.
Methodology
Since the purpose of this study is to compare four different H2 vectors, it is important to ensure that the boundary of each system is the same and the method of costing is comparable, as the resulting differentials are key.
The majority of the data used is obtained from the public domain, papers and other literature available on the internet. This contains an inherent element of uncertainty, since it is not always entirely clear what scope is included in CAPEX figures, or what items are included in total installed costs (TIC). Generally, the CAPEX used was considered to be the cost of equipment required fully installed. In-house CAPEX data is used where available, or as a benchmark against data from literature. Licensing, regulatory and infrastructure interconnections and owners’ costs are not included, nor are costs for minor utilities, as all plants need these services.
Where a wide range of data is assimilated for CAPEX vs. capacity for a particular process or storage, the data is plotted graphically, outliers are disregarded, and average or specific data are selected from within the group of data. Where the studied process required a unit capacity larger than presently available or referenced, it was assumed that several units would be required for costing purposes. Since only one full liquid H2 chain is in operation as a pilot project8 and at a small capacity, all of the costing data for LH2 is based on expectation. While gathering data, a noticeable trend was observed for LH2 liquefaction plant CAPEX reduction, which led to a sensitivity case being produced for the more optimistic data. This case shows potential savings as the technology is developed, scaled up and commercialized.
Operating costs were generated by a fixed percentage of the CAPEX to cover fixed operating and maintenance (O&M), and the major feed streams and utility user annual costs (OPEX) are based on location prices. Generally, this included the cost of the natural gas feed, power, demineralized water, cooling water, fuel gas and transportation (ship) fuel.
Infrastructure to deliver clean natural gas to the first process block in Qatar is not included. Storage tank CAPEX and OPEX are included, as these are different between the four options due to the different energy densities and ship sizes. Loading systems and jetties are not included, as it is assumed that the existing infrastructure in both Qatar and the UK will be used. However, due to the requirement for the LNG value chain to have two types of ships—LNG carriers and CO2 ships—CAPEX for berthing CO2 ships was included in both Qatar and the UK.
The system boundary for each option is detailed in the following sections. A simple heat and material balance is developed for each option, resulting in the same quantity of H2 being delivered into the UK grid. Depending on the various losses of product through the value chain, each option requires a different quantity of natural gas feed.
The study is essentially based on 500 metric tons per day (metric tpd) of H2 capacity. The resulting individual unit processes are sized based on the best information available for realistic or available equipment. This methodology also applies to typical ship sizes for the different products. LH2 value chains do not exist at present, so all unit sizes were selected on the most realistic size with accompanying CAPEX data. Included are optimistic, scaled-up unit sizes and optimistic energy reduction targets cited in the literature, so a sensitivity case is included to capture potential savings as the LH2 value chain is developed.
The same H2 production configuration was used for all options, and any additional heat integration opportunities in the processes are not considered. For example, “cold” recovery from LNG and LH2 regasification is not explored, nor is heat recovery from the NH3 and MCH processes. Therefore, good energy savings may be found in the further development of these processes.
Shipping fuel requirements proved particularly difficult to establish. It was assumed that the LNG, CO2, NH3 and MCH ships could run on LNG, and the LH2 ship would run on LH2 boil-off gas (BOG). It seems likely that ships can be fueled by NH3 in the future, but for this study it was decided to keep the fuel consistent between the options with the exception of the LH2, where BOG reliquefication on the ship is unlikely to be economic. Converting ship power requirements into LNG/LH2 usage was carried out, using a simplistic method, consistently between the different options.
The Qatargas 2 project9 LNG value chain capacity includes 2 × 7.8-MMtpy LNG mega-trains (APCI AP-X), 5 × 145,000-m3 LNG storage tanks, LPG, additional condensate berths, sulfur facilities, a fleet of 14 Q-Flex and Q-Max ships in Qatar, 3 × 220,000 m3 LNG tanks in the UK and regas facilities with a collective capacity of 15.6 MMtpy. CAPEX and OPEX are costed on a factor of (0.54 ÷ 15.6) for the entire value chain, excluding the byproducts and additional berths. Only one Q-Max ship was considered in the CAPEX.
Storage, loading, unloading and transportation costs are a significant proportion of the overall value chain. The ship size selected for each option is based on typical sizes cited in literature and referenced later; however, this may not give the most optimum or economic solution, as some options have lower ship utilization than others, which is a key parameter for optimization in any future study.
Selecting the ship size and speed defines the voyage duration and number of trips and, therefore, the number of ships required. It also defines the minimum onshore storage capacity required. For the sake of simplicity, the same capacity was assumed in Qatar and the UK. A minimum margin of 7 days of storage is included to allow for shipping delays, such as weather or ship outages.
To determine the number of ships, it is important to identify the number of trips required to transfer the total product from the export terminal to the import terminal. The total number of trips to transport a certain amount of product is calculated using the carrier capacity shown in Eq. 1:
Total number of trips = Transported capacity (metric t ÷ yr) ÷ Ship capacity (metric t) (1)
The maximum number of trips each ship can make per year must then be determined. This is achieved by calculating the number of days per trip, which depends on the carrier sea speed, calculated as shown in Eqs. 2 and 3:
Number of days per trip = [Distance (km / Ship) × speed (km / hr)]÷ 24 (2)
Number of trips per yr = Operating days in yr / Number of days per trip + turnaround days (3)
Operating days per year is assumed to be 350 days, and turnaround time in port (which consist of loading and unloading hours) is assumed to be 3 days. Therefore, the number of ships can be calculated as shown in Eq. 4:
Total number of ships = Total number of trips / Number of trips per yr (4)
Eqs. 5–7 are used to determine the storage tank volumes and number of tanks. A margin for the delayed arrival of a ship is considered.
Frequency (days) = Operating days / Total round trip (5)
Working volume (m3) = Carrier size (m3) + Minimum frequency or 7 days × Rundown rate (m3 ÷ day) (6)
Number of storage tanks = Working volume (m3) ÷ Tank capacity (m3) (7)
Cost estimation
The value chain for each option is defined, and CAPEX and OPEX were calculated for each unit within the process. For each part of the value chain, it is assumed that there are 350 operational days/yr, and the overall lifetime is 30 yr. Data gathered for each unit are scaled up or down, as required for the required unit size, using the standard estimation factor to a power. A geographical estimating factor of 0.9 for Qatar to 1 for the UK was also applied where necessary. Currency conversion factors of pounds sterling (GBP) to U.S. dollars (USD) of 1.32, and euros to USD of 1.14 are used where necessary. Feed and utility costs for each location are detailed in Table 1.
The approach taken in this study to determine the capital cost of a plant, is calculated based on the scaling factor and corresponding reference capital cost and capacity as outlined in Eq. 8:
Capital investment (S) = Capital investmentref (S0) × [Capacity (C) / (Capacityref (C0)]n (8)
Here, n is the scale factor. In this study, a scale factor of 0.6 is used. Capital investment is typically reported as USD $MM, and the capacity is reported in metric tpy of the corresponding energy vector.
The specific CAPEX per year is calculated by dividing the capital investment (S) by the plant lifetime in years. For a specific capital cost per metric t of H2, the annual capacity of the target H2 is considered as shown in Eq. 9:
Specific capital cost = CAPEX ($MM/yr) / metric t H2 (9)
As mentioned previously, the OPEX splits into a fixed OPEX, which is represented by a percentage of the CAPEX and variable OPEX, as shown in Eq. 10:
Fixed OPEX = O&M (%) × Capital investment (S) (10)
Here, fixed OPEX is reported as $MM/yr. Variable operating costs are calculated by multiplying utility data by a corresponding price, as calculated in Eq. 11:
Variable OPEX = Utility data × Price (11)
The utility data refers to the feed and utility consumption (e.g., natural gas feed, power consumption, fuel consumption, etc.) in a process reported as kWh or metric t. Prices are represented in various ranges, depending on the type of energy source, typically reported as USD/kWh or USD/metric t. Variable OPEX is then determined as $MM/yr, using Eq. 11.
To determine the specific operating cost per metric t of H2, the same approach to that of specific capital investment is applied, as shown in Eq. 12:
Specific operating cost = OPEX ($MM/yr) /metric t H2 (12)
The total process-specific cost per metric t of H2 is normally calculated as the sum of the specific CAPEX and OPEX. An exception to this is made for the LNG value chain. Since the LNG value chain is already established on a much larger scale than the 500-metric-tpd H2 requirement used for this study, CAPEX and OPEX attributed to the LNG capacity was simply prorated on the installed capacity.
The CAPEX and OPEX were calculated for each option, and the specific H2 value was calculated simplistically by dividing the CAPEX by 30 yr, adding the annual OPEX and diving the result by the final H2 production (0.171 MMtpy in all cases). This specific H2 value ($/metric t) is used to compare the overall value chains, as well as individual aspects of each option.
Part 2. This article continues in Parts 2 and 3, to be published in consecutive issues, to illustrate the results shown in Fig. 2.
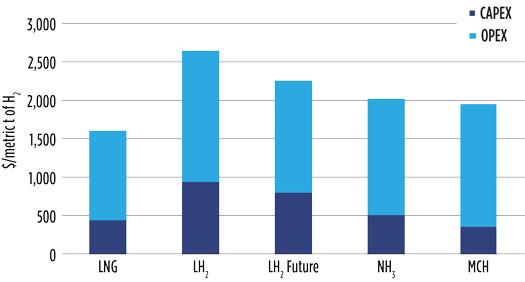
Fig. 2. CAPEX/OPEX comparison.
Notes
This article was presented at the GPA Europe Virtual Conference on May 25, 2021.
The information and data contained herein is provided by Wood, solely in respect of the paper itself and should not be considered to have consequence outside of this hypothetical study. Wood makes no representation or warranty, express or implied, and assumes no obligation or liability, whatsoever, to any third party with respect to the veracity, adequacy, completeness, accuracy or use of any information contained herein. The information and data contained herein is not, and should not be construed as, a recommendation by Wood that any recipient of this document invest in or provide finance to any similar project. Each recipient should make its own independent evaluation to determine whether to extend credit to projects with which they are involved.
Literature cited
1 ITM Power, “Sale to Linde of world’s largest PEM electrolyser,” online: https://www.itm-power.com/news/sale-to-linde-of-world-s-largest-pem-electrolyser
2 ITM Power, “HyDeploy: UK gas grid injection of hydrogen in full operation,” online: https://www.itm-power.com/news/hydeploy-uk-gas-grid-injection-of-hydrogen-in-full-operation
3 South Hook LNG, “Operations: The supply chain,” online: https://www.southhooklng.com/liquefied-natural-gas/the-supply-chain/how-it-works
4 Ports.com, “Sea route and distance,” online: http://ports.com/sea-route
5 Wikipedia, “Q-Max,” online: https://en.wikipedia.org/wiki/Q-Max
6 South Hook LNG, “Operations: What we do,” online: https://www.southhooklng.com/operations/what-we-do
7 National Grid UK, “Gas prevailing view,” online: http://mip-prd-web.azurewebsites.net
8 Kawasaki, “World’s first liquefied hydrogen carrier Suiso Frontier launches building an international hydrogen energy supply chain aimed at carbon-free society,” December 11, 2019, online: https://global.kawasaki.com/en/corp/newsroom/news/detail/?f=20191211_3487
9 Quatargas, “Operations: The trains,” online: https://www.qatargas.com/english/operations/lng-trains

Nicola Chodorowska is a Managing Consultant in the specialist engineering and consulting group at Wood in Reading, UK. She holds a BEng degree in chemical engineering and is a Fellow of the Institution of Chemical Engineers.

Maryam Farhadi is a Process Engineer in process engineering and capital projects at Wood in Reading, UK. She holds an MSc degree in process systems engineering from the University of Surrey.
Fig. 1. Transport route for LNG produced at Ras Laffan, Qatar to regasification at Milford Haven, Wales, UK.
Fig. 2. CAPEX/OPEX comparison.
From The Archives
Connect with H2Tech